Usage analytics
With the help of usage analytics, admins and users can keep track of their team's AroundDeal credit usage, gain key insights into team performance and AroundDeal usage, better understand the needs of their teams and how they interact with the platform, set benchmarks for AroundDeal usage, and optimize credit allocation in accordance with KPIs.
Usage overview
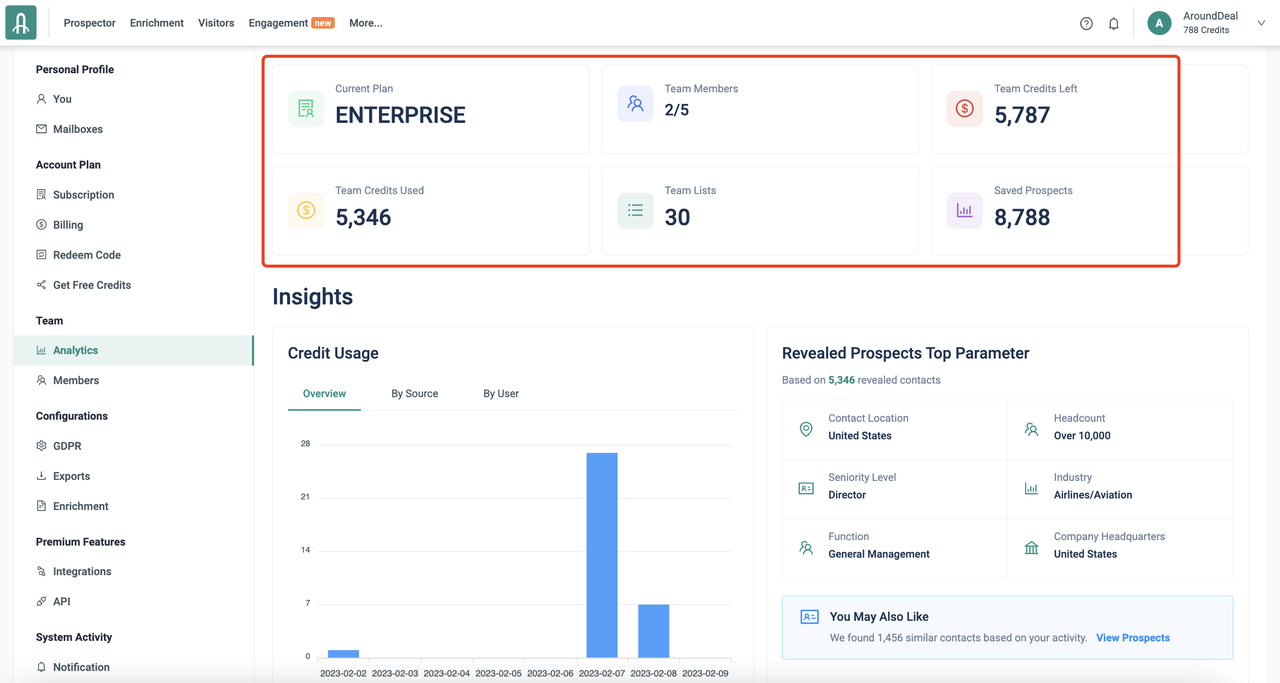
| Team Credits used | Saved Prospects | Collected details |
| View the utilization of your AroundDeal credits, the platforms where the contacts are saved, and the volume of data that was gathered. | The total number of contacts that have been imported or exported into a CRM over the course of a given time period by any one user or group of users. Useful hint: Hover your mouse cursor over the graph to reveal a breakdown of the locations where the contacts were saved. | The entire amount of information (email addresses and phone numbers) gathered throughout the previous time period by any individual user or group of users. Hover your mouse over the graphic to see a breakdown of the locations of the different contact detail categories. |
Credit usage
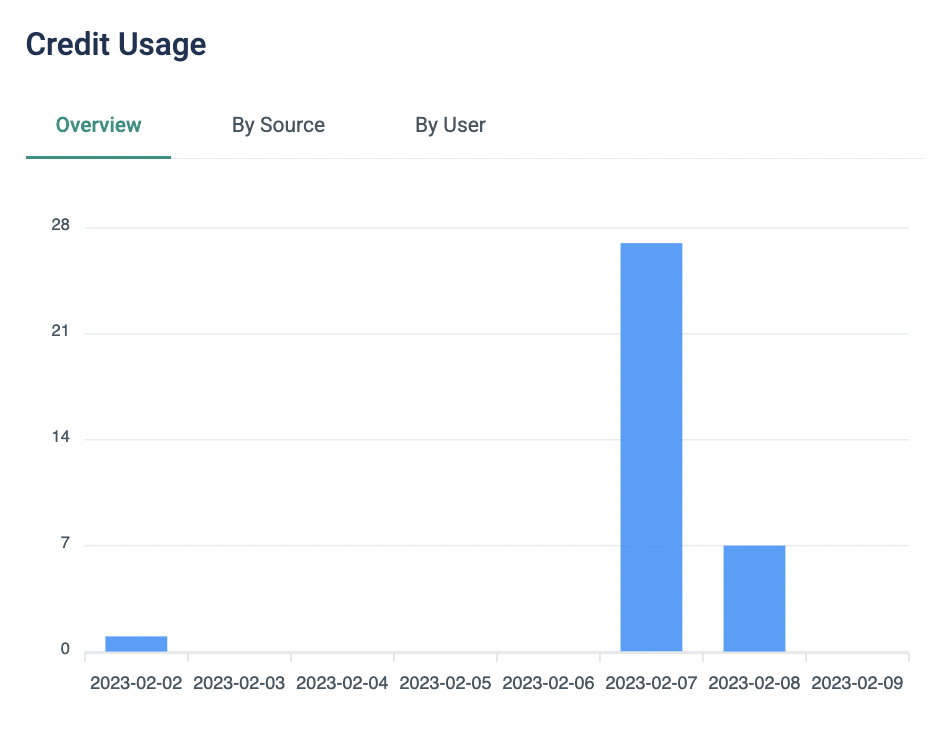
Overview
Graph displaying your monthly or daily usage of AroundDeal credits based on the time frame you've chosen.
By Source
Depending on the time frame chosen, a breakdown of your daily or monthly AroundDeal credit usage per source (e.g., LinkedIn, AroundDeal's Prospecting platform). This makes it easier for you to identify the sources of the most fruitful leads.
By User
According to the time period you choose, a breakdown of your AroundDeal credit usage will be shown by team members (up to 50 users) either daily or monthly. To understand how you and the team are using AroundDeal credits, use the graphic below.
Pro tip
Use groups to filter the users and build a report for each group in order to create a report for 50 or more users (instead of one by one).
Revealed contacts top parameters
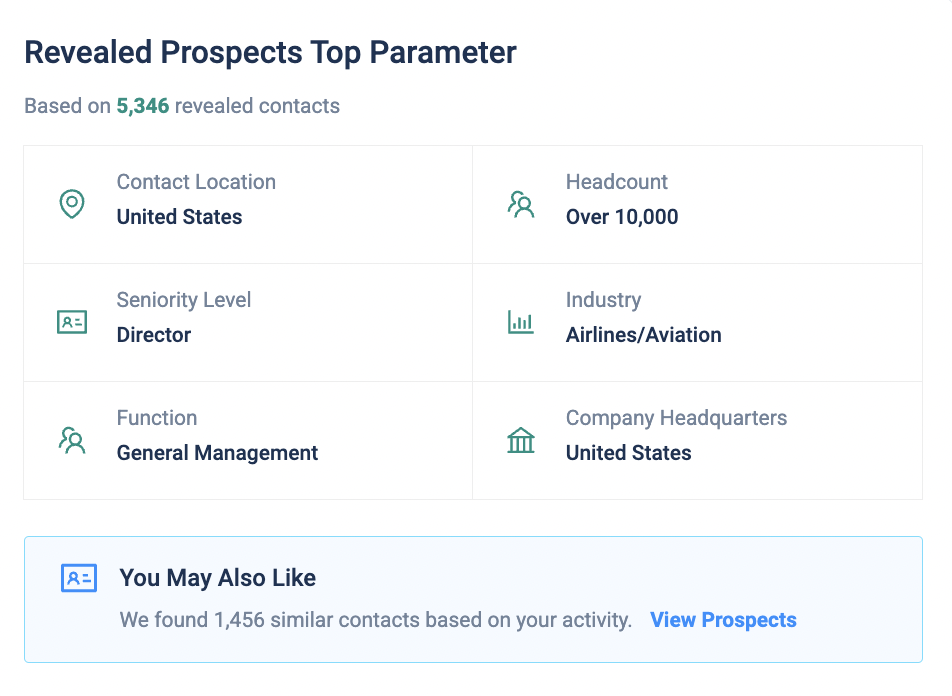
Your aggregated ideal consumer is one of We Revealed Contact's main parameters!
This view is divided into many parameters, and for each parameter, it displays the most common value among all of your displayed contacts. For instance, in the figure above, "Airlines/Aviation" is the Industry that all of the contacts who have been revealed most frequently have.